Migrating NDT clients to ndt7
Following the general availability of the ndt7 protocol, we will be working with NDT client integrators to support their migration to ndt7. As they do, the NDT dataset will shift from predominantly ndt5 to predominantly ndt7. As part of assessing our readiness for this larger effort, a pilot was started on July 8.
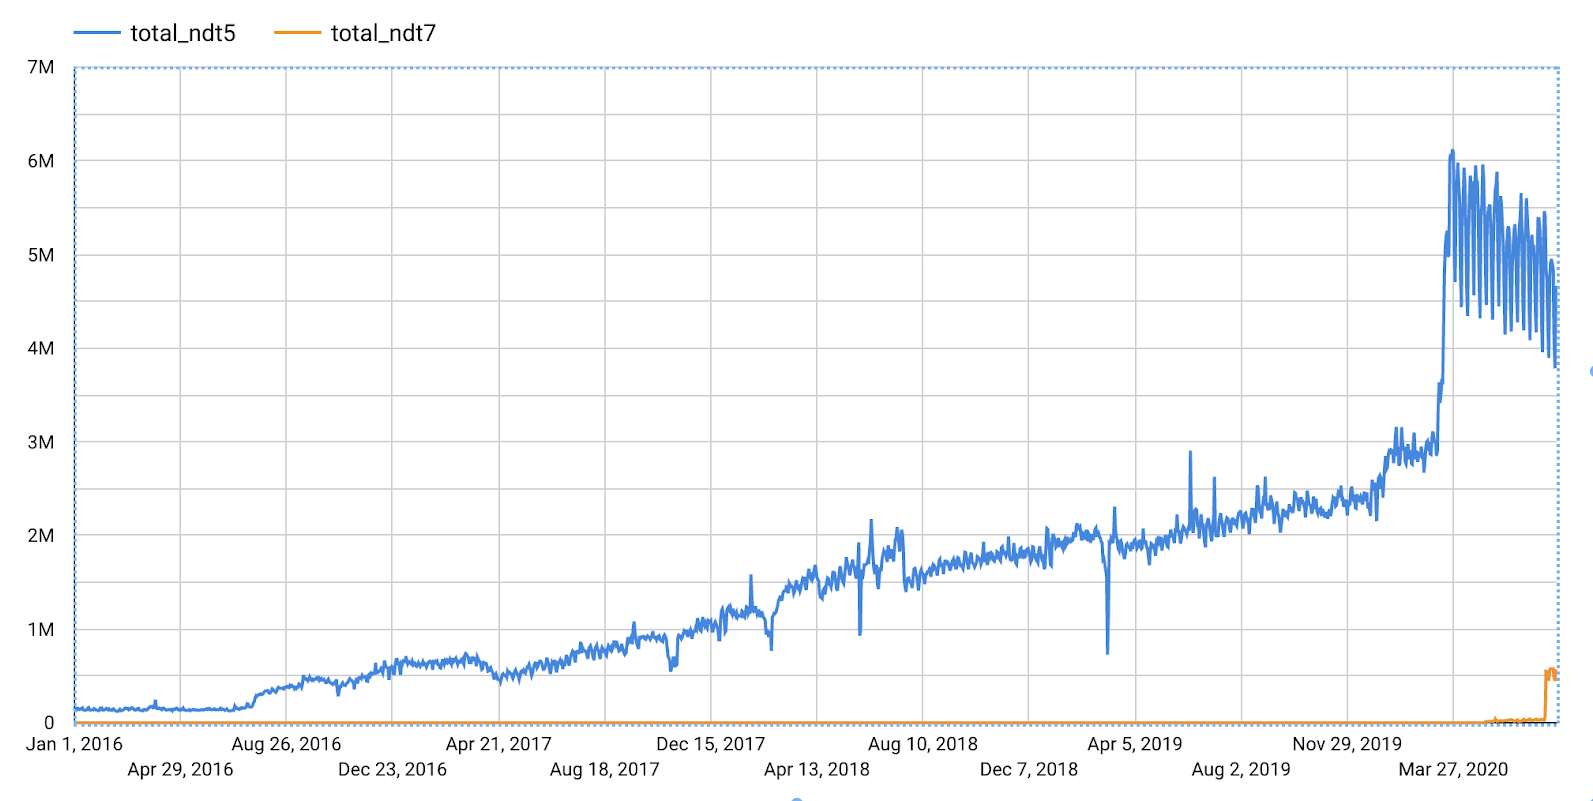 Figure 1: Total number of ndt5 and ndt7 measurement rows over time. The total_ndt5 count rows from the measurement-lab.ndt.unified_uploads and measurement-lab.ndt.unified_downloads views. The total_ndt7 counts rows from not-yet-published tables. The ndt7 rows currently represent about 10% of total NDT measurements.
In the last four years the NDT measurement volume increased from less than 500k/day to over 5M/day. Since early July, approximately 10% of NDT traffic is now using the ndt7 protocol.
Over the next few weeks, we expect approximately 40% of all NDT measurements to be from clients using the ndt7 protocol, followed by approximately 80% shortly after that. We expect a long tail of clients continuing to use the ndt5 protocol.
The ndt5 protocol is not going away anytime soon. While we recommend ndt7 for new integrations and continue working to migrate existing integrations, ndt5 will continue to run on the platform supporting the many clients that rely on it to provide users with NDT measurements worldwide. We will continue to support existing ndt5 integrations into the foreseeable future.
Entry Criteria
Since early July we have run a global pilot migration to ndt7 for about 10% of NDT clients. As we have done in past migrations, we are using these measurements to assess whether ndt7 preserves or improves client performance.
The entry criteria use two datasets:
Together, these datasets allow the comparison of ndt5 and ndt7 measurements from the same clients.
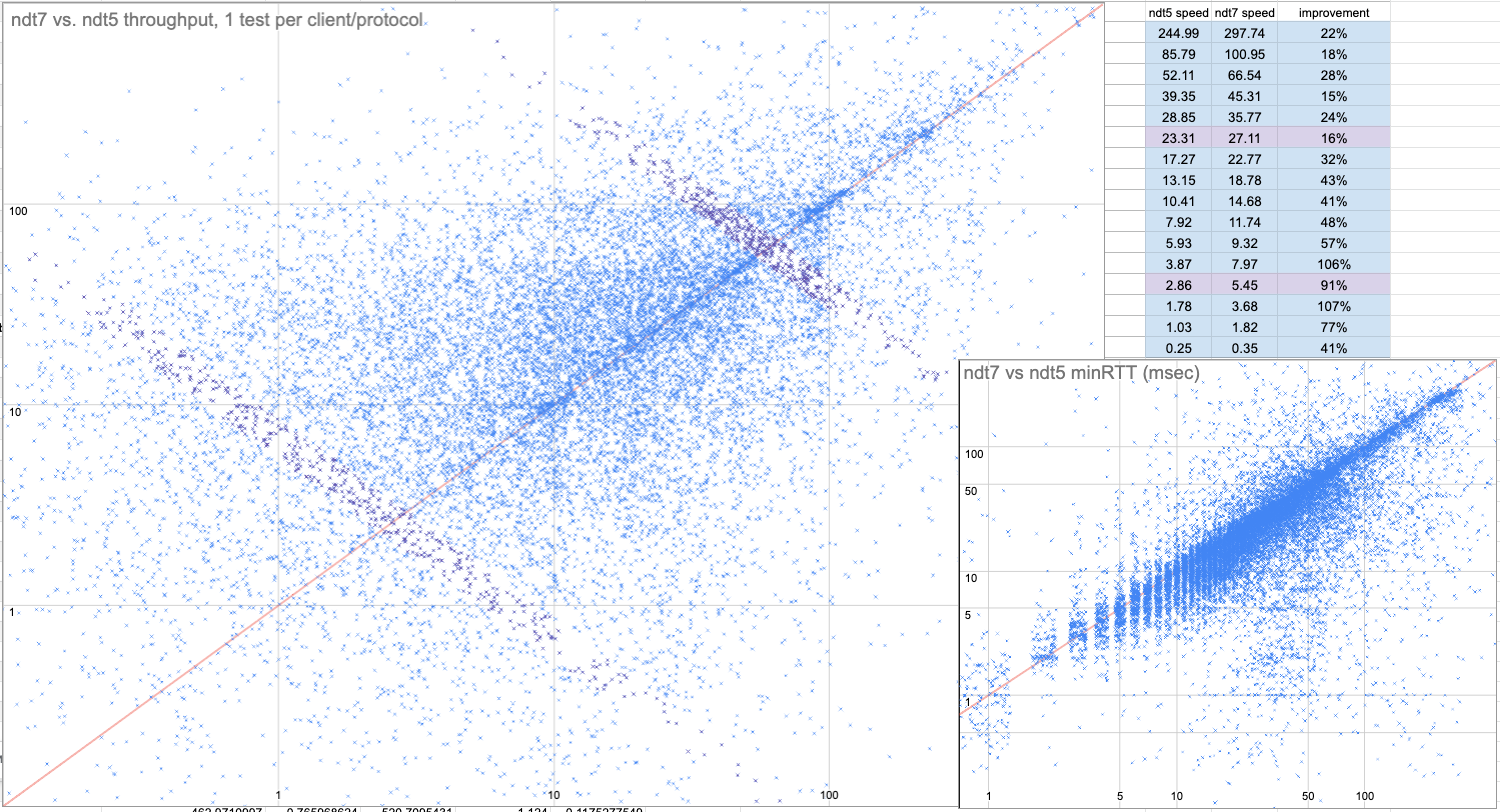 Figure 2: Scatter plots of ndt5 and ndt7 performance.
The large subplot reports client download bandwidth in Mbps. The small subplot reports client minRTT in milliseconds. In both plots, ndt5 metrics are plotted using the x-axis, and ndt7 metrics using the y-axis.
The table reports the geometric means of speeds for clients within distinct speed bands; for example, see the two shaded bands and corresponding rows in the table. Each row reports percent speed improvement. In all cases, ndt7 clients saw average improvements.
Figure 2 shows download measurements from clients with one ndt5 measurement in the week before a client migration to ndt7, and one ndt7 measurement in the week following the migration. We chose IP addresses with few measurements to reduce the likelihood of including multiple households behind carrier-grade NATs (CGNAT), which could add noise to the comparisons. The vertical bands in the minRTT plot are caused by ndt5 1 msec quantization. To improve visibility, we fuzzed along the x-dimension to spread them out.
The general trend shows that ndt7 returns much lower minRTT values compared to ndt5, suggesting that BBR does a better job avoiding queuing. Though the throughput data is quite noisy, BBR achieves, on average, roughly 44% higher throughput than Cubic.
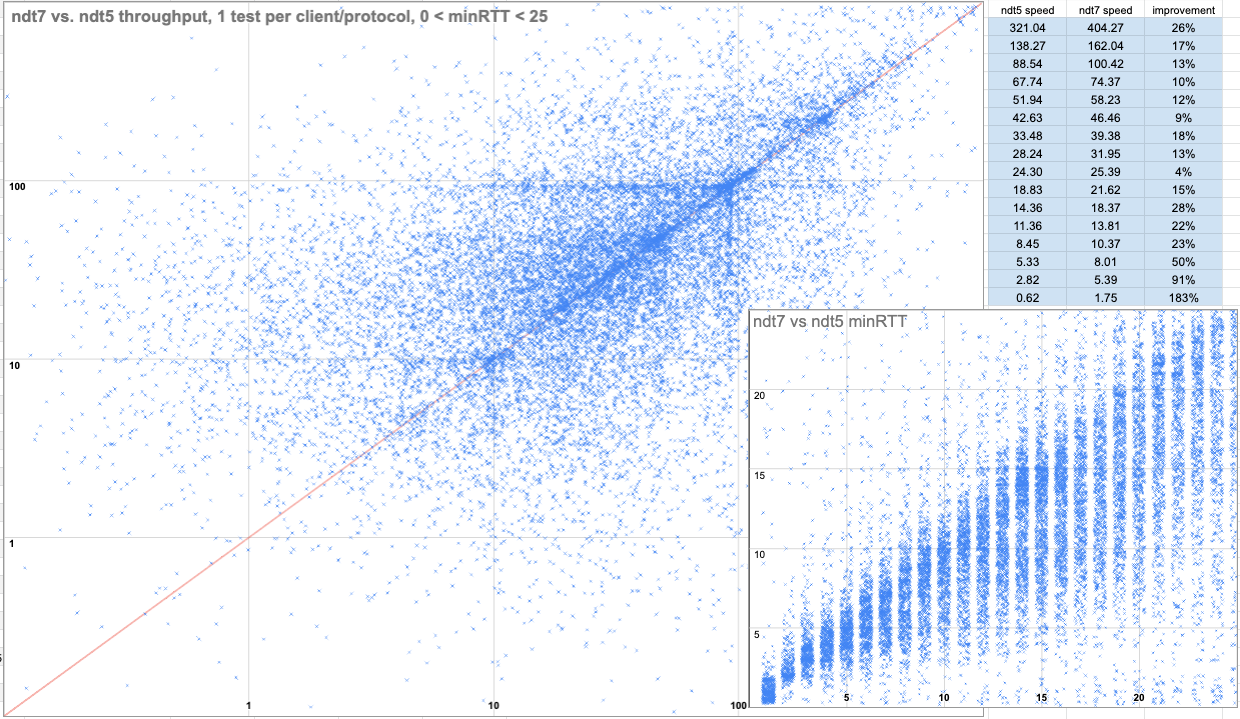 Figure 3: Scatter plots of ndt5 and ndt7 performance, like figure 1, with samples restricted to clients having both minRTT measurements below 25 msec.
Figure 3 shows a smaller sample of clients with minRTT less than 25 msec. In the minRTT subplot, ndt5 clients are much more likely to have higher minRTT values than ndt7 clients. This suggests that BBR is successfully preventing buffer bloat. In the throughput subplot, clustering is more apparent around 10, 25, 50, 100, and 220 Mb/sec performance tiers.
Timeline
While community developers control their own NDT client integrations, M-Lab will work with them on the rollout, migration, and validation of ndt7. Before the majority of clients migrate to ndt7 we will complete the following:
- The ndt7 data will be published to measurement-lab.raw_ndt.ndt7
- The ndt7 tables will have complete documentation on the M-Lab website
- The charts in the analysis above will be reproducible using public tables
- The ndt7 data will be included in the NDT unified views
- As the migration advances, there will be less ndt5 data and more ndt7 data
- Publish advice for working with the longitudinal history of all NDT data
After these are complete, we will continue the work to migrate the majority of NDT clients to use ndt7.
The migration to ndt7 with BBR provides model based metrics about the global Internet. These are generational updates of tools that help us investigate and understand networks and a foundation for exciting future work. We look forward to exploring it with you.