Exploring NDT Data by Geography in Baltimore City
Baltimore Data Day is an annual conference bringing together “community leaders, nonprofit organizations, government and civic-minded technologists to explore trends in community-based data and learn how other groups are using data to support and advance constructive change.” This year the 11th annual event expanded to become Baltimore Data Week, celebrating the 20th anniversary of the conference’s host organization, the Baltimore Neighborhood Indicators Alliance (BNIA). As a Baltimorean myself, I was honored to be invited to give a talk about the M-Lab platform and our open data, on the conference’s “Digital Inclusion Day.”
Supporting Community - Data Initiatives
The Baltimore Neighborhood Indicators Alliance is at the Jacob France Institute at the University of Baltimore, whose mission is to, “provide open access to meaningful, reliable, and actionable data about, and for, the City of Baltimore and its communities.” BNIA is a member of a national network of organizations called the Community Indicators Consortium, whose mission “advances and supports the development, availability and effective use of community indicators for making measurable and sustainable improvements in quality of community life.” BNIA’s annual Data Science Corps program provides internship opportunities for local undergraduate students to gain experience through data science projects. BNIA’s invitation to present about M-Lab came after their staff contacted us to inquire about our open data, and support for one of their Data Science Corps interns.
The COVID-19 pandemic has exposed what many people and organizations already knew– that quality, affordable Internet access is not available to everyone equitably, and disparities in access, provider choice, quality of service, and affordability need to be addressed. Digital Inclusion organizations and coalitions at the local and national level have been working hard to provide access to people who are not connected, to address these disparities in this extremely challenging time. For example, the Baltimore Digital Equity Coalition was formed to respond to the needs that COVID-19 exacerbated, forming a rapid response in key areas: access to devices, greater Internet connectivity, digital skills training and technical support, and advocacy.
BNIA and their Data Science Corp were looking for baseline data measuring the performance and quality of Internet service across the city, and sought a way to assess the service being provided or improved through the Baltimore Digital Equity Coalition’s initiatives. Data Science Corps members, Ruth Robinson and Priya Kanneboyina, published this blog post as a result. Definitely check out the awesome work BNIA and the Data Science Corps are doing.
Exploring M-Lab Data by Geography
The initial exploration of M-Lab data and my talk at Baltimore Data Week provides a good example of what communities can learn from M-Lab’s data, particularly when grouping or aggregating data by geographic areas.
When exploring or aggregating M-Lab test data by geographies, it’s important to understand the limits of geographic granularity in our public data in BigQuery. When you run an M-Lab test, in addition to providing you with a measurement, we collect the IP address assigned to your cable modem, router, etc. by your ISP. By looking up the IP address in a publicly available dataset, we “annotate” each test result with geographic fields like latitude and longitude coordinates, continent, country, city, and postal code. IP address geolocation is not street address level accurate like a GPS might be, so we usually recommend aggregating M-Lab data at the city or county level in the United States when using our public data.
Let’s look at an example to illustrate this limitation. One of the great things about organizations like BNIA is their focus on data. For this example I’ve used BNIA’s Geographic Information Systems (GIS) shapefiles for Baltimore’s “statistical community areas”. Shapefiles define a perimeter boundary for a geographic area, and provide a way to correlate data from multiple datasets that have geographic properties, such as demographic data from the US Census. BNIA’s community mapping work is awesome, and I’m looking forward to exploring their community mapping resources in more depth.
You can use shapefiles in multiple ways, and with different programs or services. For this exploration I used BNIA’s GIS Community Areas shapefile in the desktop GIS program, QGIS, and also imported the areas into a BigQuery table. I also used shapefiles for US Counties provided by the US Census for this analysis.
Initial Exploration in QGIS
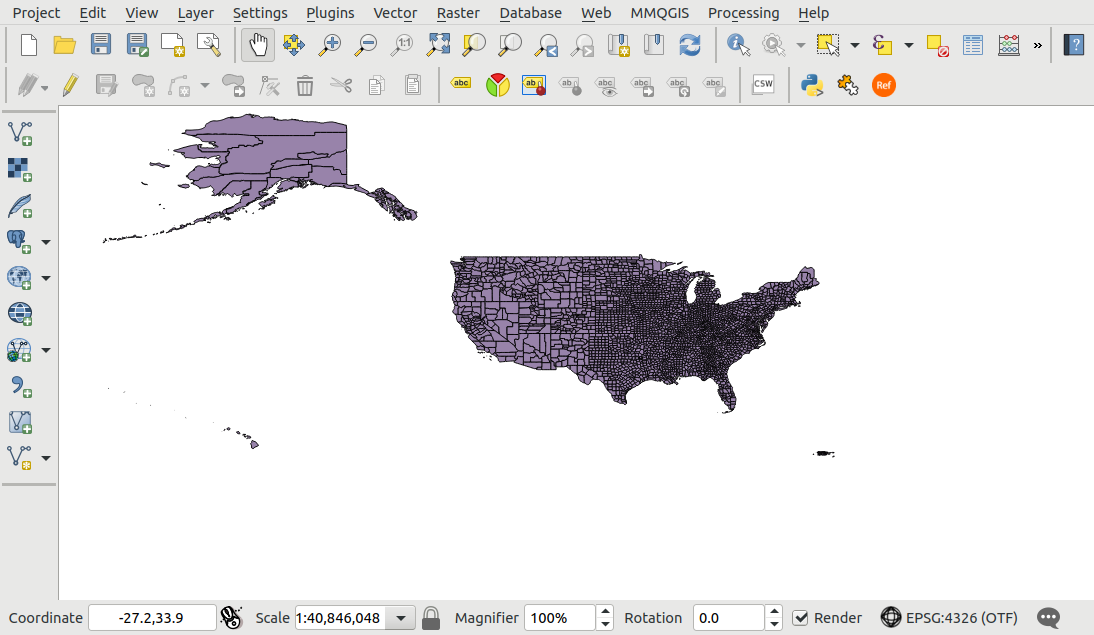
A desktop GIS program is maybe the most common way people interact with shapefiles. QGIS is an open source program, and is akin to the commercial software, ArcGIS from ESRI. Both programs allow you to import “layers” of various data types. First, I created a base map of the US by loading the US Census’ shapefile for Counties.
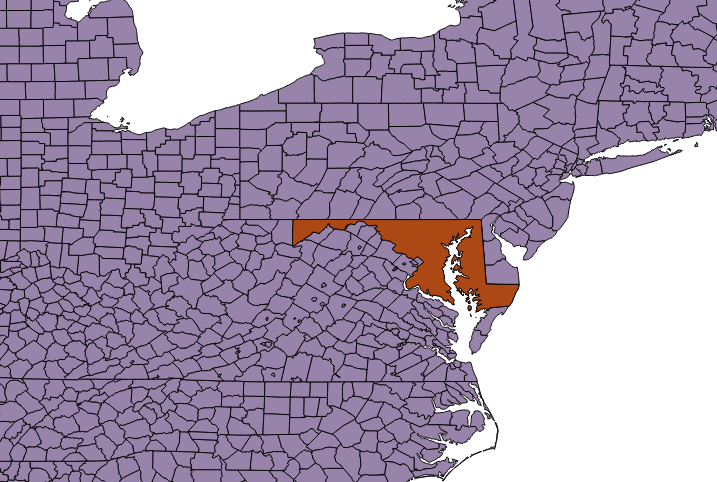
I also added a layer for US States, and filtered to show just Maryland.
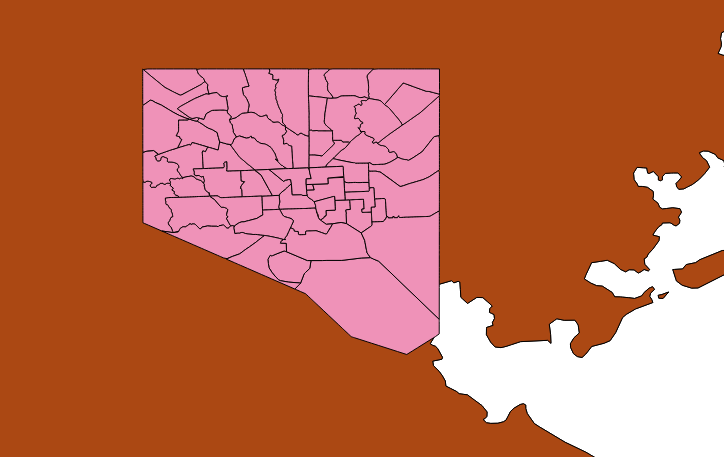
Finally, I imported BNIA’s shapefile for Baltimore’s community statistical areas.
Now we’re ready to add data from M-Lab. That data could take many forms, from aggregate measurements by community area, color coded by the average, median, or other statistic for download or upload speed. M-Lab’s measurement service, NDT, provides a baseline measurement of TCP’s reliability, using a single stream of data. TCP stands for Transmission Communication Protocol and is what computers use to send and receive data over the Internet. Since we’re just exploring at this point to see what is possible, I started with looking at where in the city NDT tests from 2020 have been located in our public dataset.
To obtain the common latitude and longitude coordinates for all tests in 2020 submitted by Marylanders in Baltimore City, I used BigQuery to search M-Lab’s NDT data. If you’re interested in querying our data yourself, sign up your Google account to our access group by following the M-Lab Quickstart guide. We have some documentation online as well, and you can obtain some sample queries from my Baltimore Data Week slide deck. Here is the query I used, which returns a total of 50 common latitude and longitude points:
WITH dl AS (
  SELECT client.geo.latitude AS latitude, client.geo.longitude AS longitude
  FROM `measurement-lab.ndt.unified_downloads`
  WHERE client.geo.country_code = "US"
  AND client.geo.region = "MD"
  AND client.geo.city = "Baltimore"
  AND test_date >= "2020-01-01"
  GROUP BY latitude, longitude
),
ul AS (
  SELECT client.geo.latitude AS latitude, client.geo.longitude AS longitude
  FROM `measurement-lab.ndt.unified_uploads`
  WHERE client.geo.country_code = "US"
  AND client.geo.region = "MD"
  AND client.geo.city = "Baltimore"
  AND test_date >= "2020-01-01"
  GROUP BY latitude, longitude
),
joined AS (
  SELECT * FROM dl
  JOIN ul USING (latitude, longitude)
)
SELECT * FROM joined
GROUP BY latitude, longitude
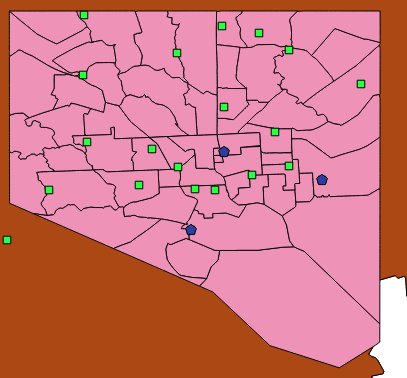
Then I downloaded the results as a CSV file, and imported it as a “Text Delimited Layer” in QGIS. The image below shows those 50 points within Baltimore City.
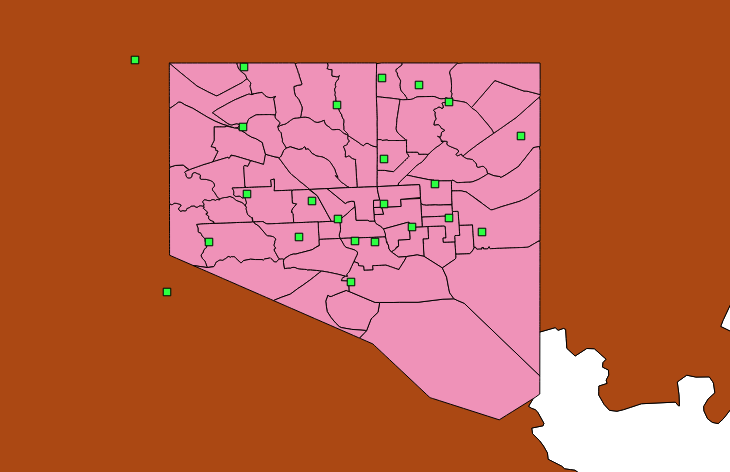
You’ll note that there is not a geo point within each neighborhood, which means that aggregating M-Lab default data by Baltimore community areas will be informative, but will not be definitive. To further illustrate this issue, I queried NDT data for the three IP addresses that have been assigned to my home Internet connection since May 1, 2020. I hope you’re chuckling right now because, yes, I periodically check what IP address I get assigned. The map below on the left is from the BNIA website and has my neighborhood, Highlandtown, highlighted in orange. The map on the right adds three points on the map where my IP addresses have been located by M-Lab. None of the points actually land in the Highlandtown community area.
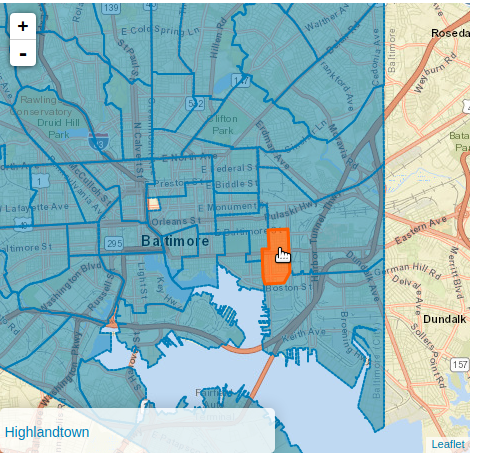 |  |
Digging Deeper - What else can M-Lab’s NDT Data tell us about Baltimore Community Areas?
As the analysis above shows, aggregating NDT data by geographic areas this small won’t give us a definitive answer about the overall service of residences in these areas. However, it can give us an indication of what to look for next, or provide an indicator of disparity in measurements around these points in the city where ISP infrastructure is located. To illustrate this, let’s see what the actual aggregate statistics are by community area.
In BigQuery, I used a more complex query that uses GIS functions to aggregate statistics for each community area. The query below calculates the 5 number summary for each community area between Jan 1 and June 30, 2020. A subset of the results for download tests are in the table following the query.
WITH
bmore_communities AS (
  SELECT * FROM `measurement-lab.geographies.baltimore_community_statistical_areas`
),
dl AS (
  SELECT a.MeanThroughputMbps AS download_mbps, community
  FROM `measurement-lab.ndt.unified_downloads`, bmore_communities
  WHERE client.geo.country_code = "US"
  AND client.geo.region = "MD"
  AND client.geo.city = "Baltimore"
  AND test_date BETWEEN "2020-01-01" AND "2020-06-30"
  AND ST_WITHIN(
    ST_GeogPoint(
      client.Geo.longitude,
      client.Geo.latitude
    ), bmore_communities.WKT
  )
)
SELECT
  community,
  MIN(download_mbps) as MIN_download,
  APPROX_QUANTILES(download_mbps, 100) [SAFE_ORDINAL(25)] AS Q25_download,
  APPROX_QUANTILES(download_mbps, 100) [SAFE_ORDINAL(50)] AS MED_download,
  AVG(download_mbps) as AVG_download,
  APPROX_QUANTILES(download_mbps, 100) [SAFE_ORDINAL(75)] AS Q75_download,
  MAX(download_mbps) AS MAX_download
FROM
  dl
GROUP BY community
ORDER BY community
| Community | MIN | Q25 | MEDIAN | AVG | Q75 | MAX |
| Allendale/Irvington/S. Hilton | 0 | 5.85 | 26.99 | 78.67 | 94.11 | 1363.68 |
| Beechfield/Ten Hills/West Hills | 0 | 5.74 | 26.67 | 77.9 | 93.03 | 1363.68 |
| Belair-Edison | 0 | 5.74 | 26.67 | 77.9 | 93.03 | 1363.68 |
| Brooklyn/Curtis Bay/Hawkins Point | 0 | 5.74 | 26.67 | 77.9 | 93.03 | 1363.68 |
| Canton | 0 | 5.74 | 26.67 | 77.9 | 93.03 | 1363.68 |
| Cedonia/Frankford | 0 | 5.59 | 25.93 | 76.81 | 92.23 | 1363.68 |
| Cherry Hill | 0 | 5.74 | 26.67 | 77.9 | 93.03 | 1363.68 |
| Chinquapin Park/Belvedere | 0 | 6 | 27.16 | 79.26 | 95.29 | 1363.68 |
| Claremont/Armistead | 0 | 5.74 | 26.67 | 77.9 | 93.03 | 1363.68 |
| Clifton-Berea | 0 | 5.96 | 27.33 | 79 | 94.15 | 1363.68 |
The first thing you’ll likely note in the results table, is that many of Baltimore’s community areas seem to have very similar median and average values. We might expect that given the geographic issues described above. But looking at the spread of values shows that there is wider variation in measured values, which demonstrates that there are inequities in service quality that persist across Baltimore. This warrants further exploration, and to really get to definite answers about the Internet service of Baltimoreans by community area, we will need to collect tests with more specific geographic accuracy.
M-Lab Community Tools for Collecting New Data with Geographic Precision
Because M-Lab maintains a public archive of our measurement data, we sacrifice a bit of geographic accuracy by annotating our test data using the IP address. It’s a tradeoff. This disadvantage is the geographic issue demonstrated in this post. However, the advantage is that we’re respecting the privacy of people who run tests. But there are ways for communities to collect locally specific data using open source tools that use the M-Lab platform. We’ve supported and developed applications that communities can use to collect new test data with more geographic precision.
Piecewise - Public Engagement Web Portal
Piecewise is an open-source public engagement portal that collects both user-volunteered survey responses and NDT measurements. Data collected by an instance of Piecewise is visually aggregated on the web and mapped on top of M-Lab’s public dataset. Prior to completing the survey and test, each visitor is prompted to “share their location” in the browser. If selected, the application collects a more accurate location, the community running the Piecewise instance collects this information on their server, but only the test results and IP address are sent to M-Lab. Running a Piecewise installation requires a web server that supports Docker.
M-Lab Measure - Chrome Browser Extension
The M-Lab Measure Chrome browser extension provides an extension for the Chrome web browser to run NDT tests. Features include scheduling tests, annotating results, selecting a specific M-Lab server, saving test results in an SQL Lite database in the user’s browser profile, and exporting results to a local CSV file. By annotating results with metadata about each location, service provider, service tier, etc., the extension can be one means of collecting new tests with more geographic accuracy, without having to setup and run a website.
Murakami - Premise Device Automated Measurement Tool
Murakami is an application that runs M-Lab and other measurements automatically from a dedicated computer installed on-premise. Many such devices can be installed at locations where a community wants to collect measurements. Ongoing measurements from known locations like community anchor institutions can be collected in a central data archive. For example, M-Lab partnered with Simmons University over the last 2 years on a research program to run Murakami devices within public libraries across the US. By measuring at known locations with specific known metadata like ISP, service tier, street address, etc., this automated approach is more suitable for research because it avoids potential issues such as using solely crowdsourced tests.
Conclusion
I hope this post has been informative about the default geographic specificity of M-Lab’s NDT data. When the desire is to examine local trends and statistics in our data at smaller geographies than city or county, the need to collect new data at the community level becomes more important. One of our goals is to enable communities to use our platform as a service, to enable new data collection with more accuracy, and the tools mentioned here can help with that. As always, we’re also here to support and answer questions about these tools or our platform and data. Reach out to support@measurementlab.net to get help.